Greenland has now marked the 30th consecutive year where it lost more ice than it gained.
This guest post is by:
Dr Martin Stendel, climate scientist at the Danish Meteorological Institute (DMI), part of the Polar Portal
Prof Ruth Mottram, climate scientist at DMI and honorary professor at Aarhus University
Over the 12-month period to August 2026, the world’s second-largest ice sheet lost around 135bn tonnes of ice.
This major ice loss came as the region experienced a relatively cool start to summer and less surface melt than in previous years.
In other words, it was not an “extreme” year for weather in Greenland – and, yet, the ice sheet ended firmly in the red.
Three decades of continuous ice loss in Greenland is significant, given that scientists typically need 30 years of data to separate the “fingerprint” of human-caused climate change from natural variations in the climate.
In Greenland, the direction of travel has been the same – downward – every single year for 30 years.
These latest figures come as a new report highlights that ice melting processes seen for decades in Greenland are increasingly being replicated in Antarctica.
Greenland, therefore, is not only the largest present-day source of ice-driven sea level rise – but offers a preview of what is in store for the world’s largest ice sheet.
(For our previous analyses of Greenland’s ice cover, see coverage in 2025, 2024, 2023, 2022, 2021, 2020, 2019, 2018, 2017, 2016 and 2015.)
Surface mass balance
One way that scientists track the health of the Greenland ice sheet is by tracking changes to its “surface mass balance”.
This is the difference between ice gains from snowfall and losses from melt at the surface of Greenland’s ice sheet.
Greenland’s annual ice cycle runs from 1 September through to the end of August. The surface mass balance at the end of this period has, to date, always been positive, because the surface accumulates more snow than it loses from melting ice.
The ice sheet typically gains mass during the colder months of autumn, winter and spring. Then, as temperatures increase from around mid-June, the ice sheet begins to lose more ice through surface melt than it gains from snow.
(Greenland also loses ice when icebergs break off – or “calve” – into the sea, as well when the front of glaciers melt when they meet warm sea water. These losses are included in the “total mass balance” – see below.)
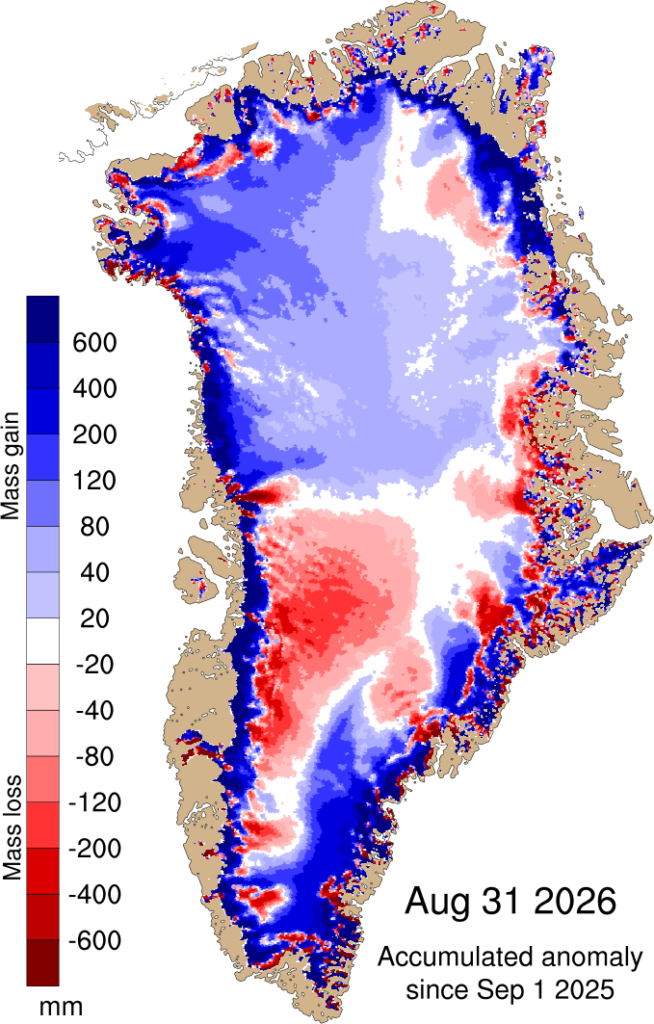
Greenland ended 2025-26 with an overall surface mass balance of 519bn tonnes.
This is the sixth highest in a dataset stretching back 46 years and about 178bn tonnes above the 1981-2010 average of roughly 350bn tonnes.
The map below shows the difference between the surface mass balance in 2025-26 and the 1981-2010 average, where blue shows ice gain and red shows ice loss.
The blue lines in the charts below show the surface mass balance throughout 2025-26 for individual days (top) and cumulatively throughout the year (bottom). They highlight how Greenland gained ice between September 2025 and May 2026, before starting to lose ice from June onwards.
Total mass balance
Another way scientists measure the health of the Greenland ice sheet is by looking at its “total mass balance”.
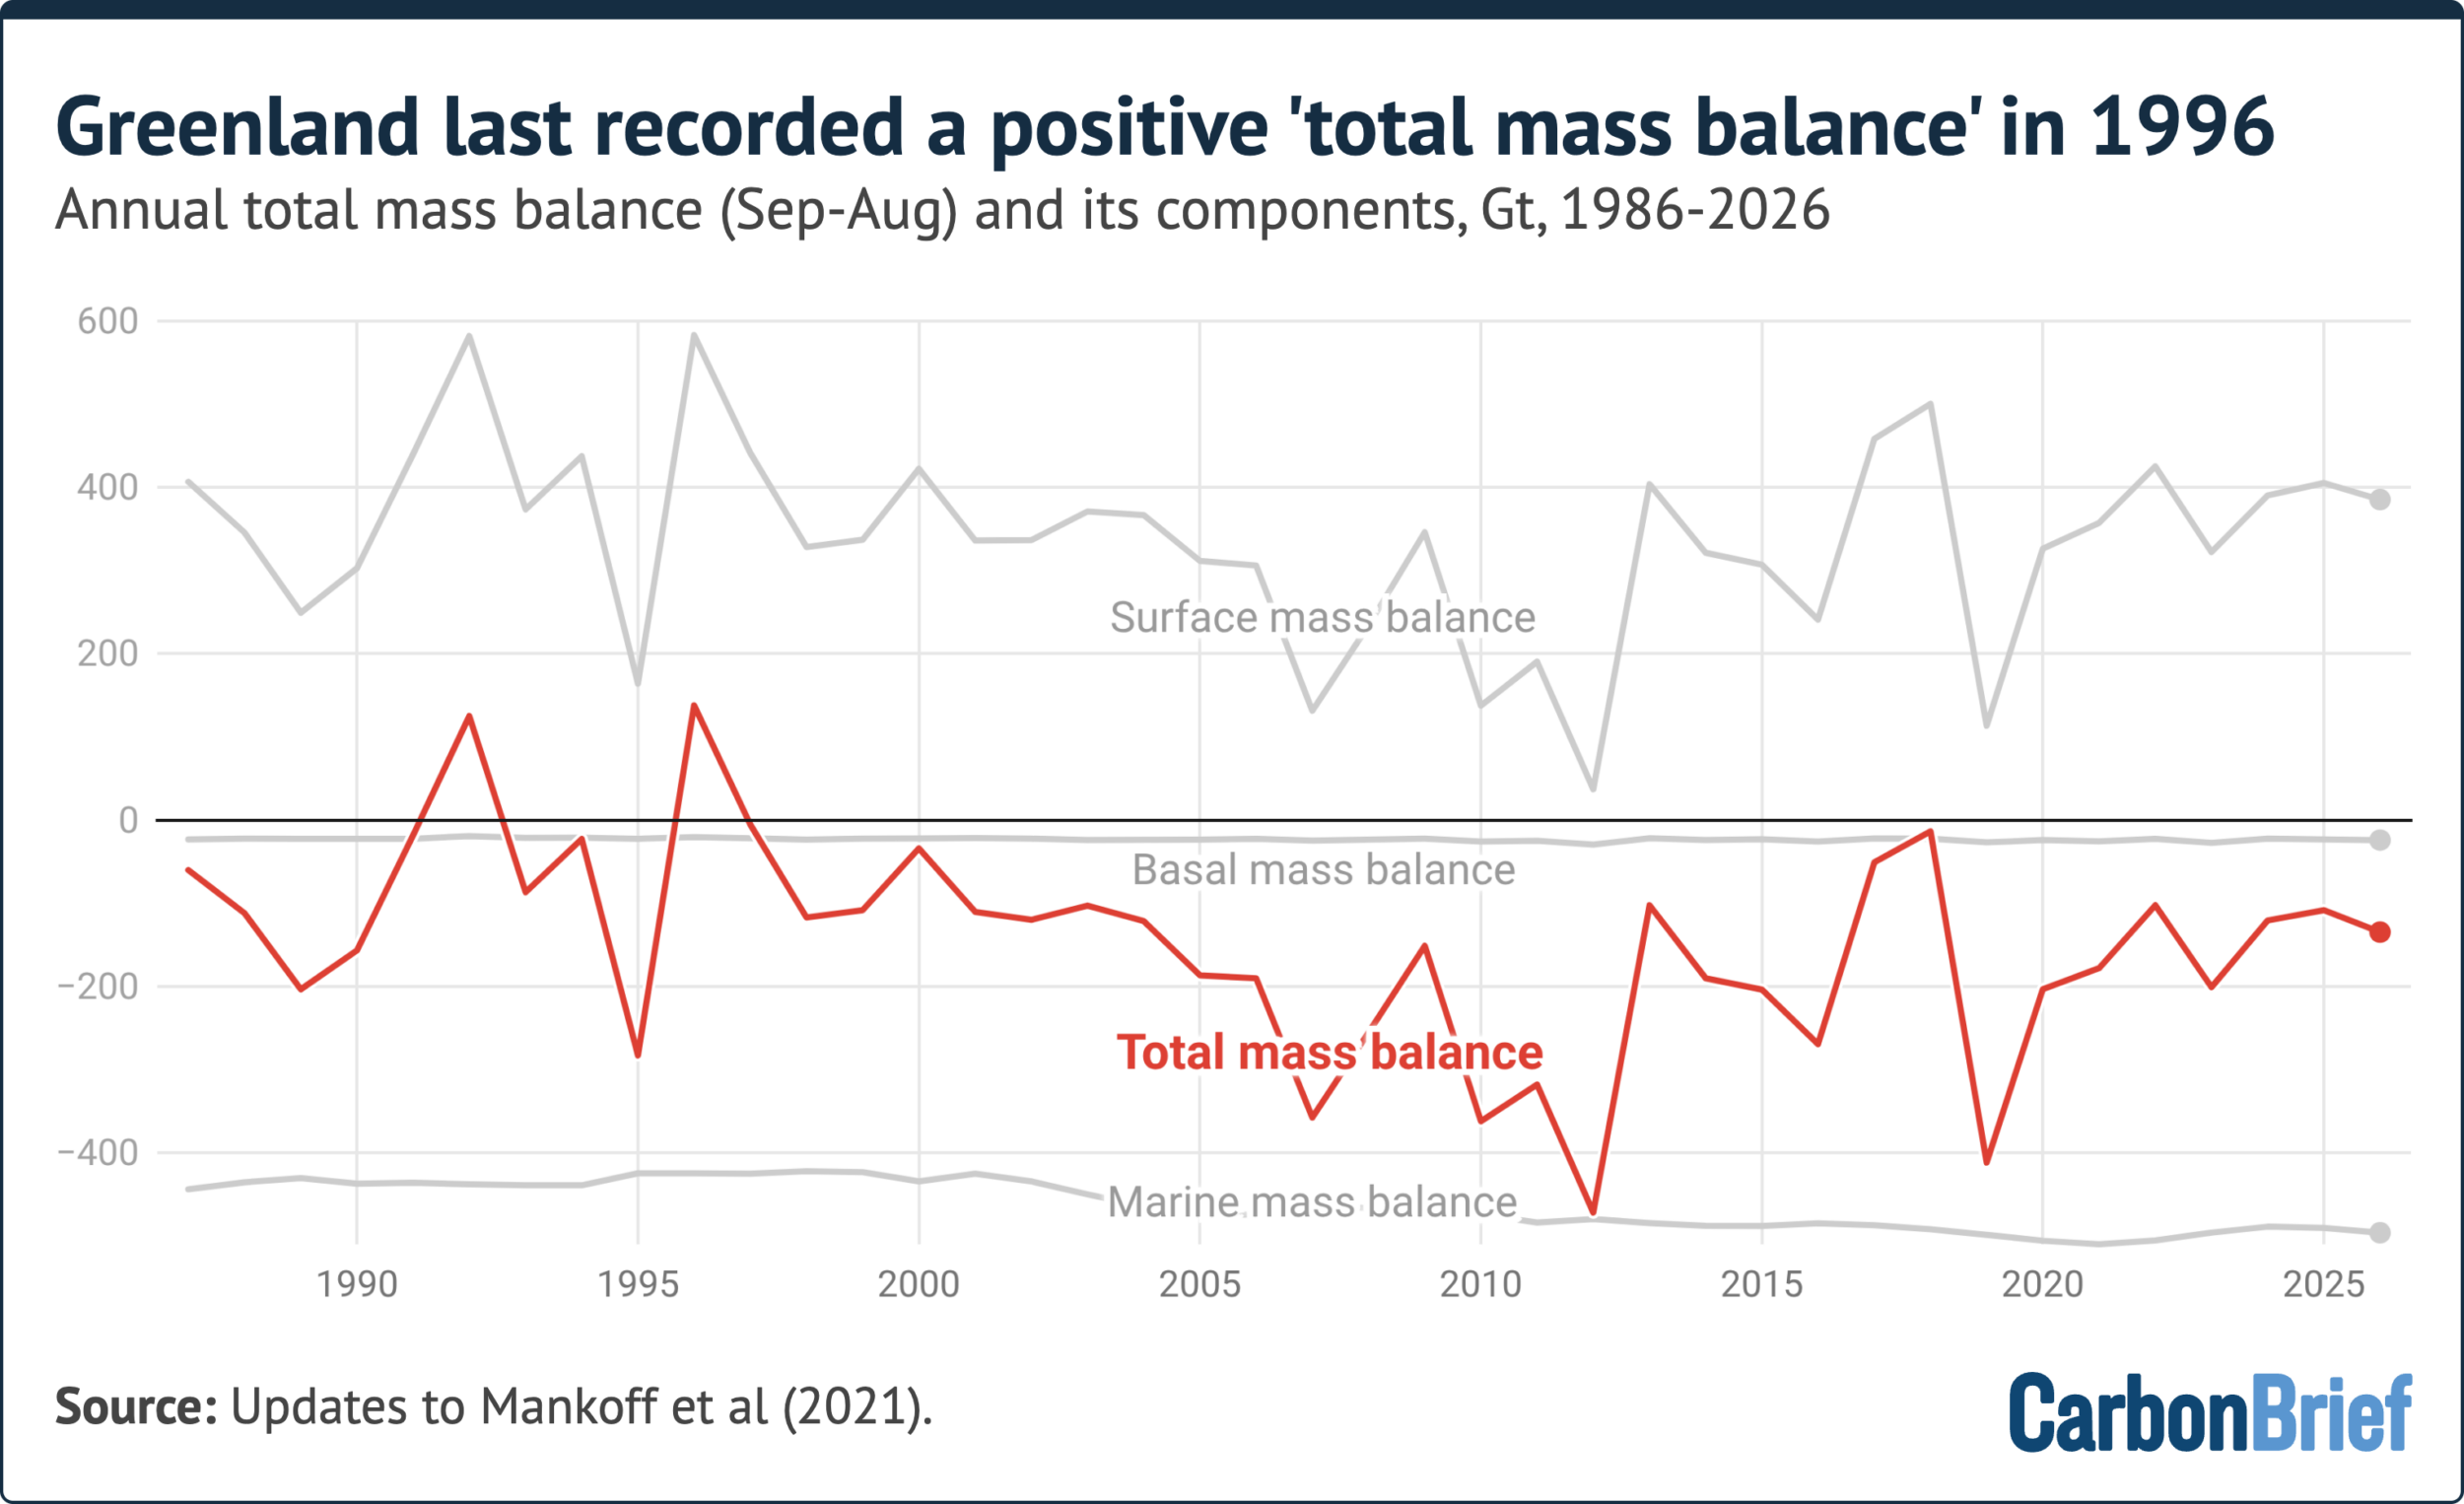
This calculation accounts for ice loss at the surface, as well as the calving of icebergs and the melting of glacier fronts where they meet warm seawater. The latter two components are known as the “marine mass balance”.
It also accounts for a small amount of ice melt at the underside of the ice sheet. This is known as the “basal mass balance”.
In recent decades, Greenland’s total mass balance at the end of the ice cycle year has been negative.
The 12 months to August 2026 were no different. Once all these factors are considered, Greenland lost around 135bn tonnes of ice.
We reached this figure using the same method featured in previous Carbon Brief analyses of Greenland ice cover. This approach is based on an average of three climate models.
Free fortnightly newsletter
.preheader p{
margin-top: 0;
font-family: ‘PT Sans’, sans-serif;
font-weight: var(–type–3–font-weight–bold);
color: var(–button–color);
font-size: var(–button–font-size, inherit);
}

.newsletter-inline{
display: flex;
border: solid 1px #333333;
padding: 1em;
background: #ffffff;
}
.inline-email{
display:inline-block;
margin-right:1em;
margin-top:0 !important;
margin-bottom:0.5em;
}
#field_submit{
display:inline-block;
margin-top:0 !important;
}
.gform_wrapper .gfield+.gfield{
margin-top:0
}
gform.initializeOnLoaded( function() {gformInitSpinner( 5, ‘https://www.carbonbrief.org/wp-content/plugins/gravityforms/images/spinner.svg’, false );jQuery(‘#gform_ajax_frame_5’).on(‘load’,function(){var contents = jQuery(this).contents().find(‘*’).html();var is_postback = contents.indexOf(‘GF_AJAX_POSTBACK’) >= 0;if(!is_postback){return;}var form_content = jQuery(this).contents().find(‘#gform_wrapper_5’);var is_confirmation = jQuery(this).contents().find(‘#gform_confirmation_wrapper_5’).length > 0;var is_redirect = contents.indexOf(‘gformRedirect(){‘) >= 0;var is_form = form_content.length > 0 && ! is_redirect && ! is_confirmation;var mt = parseInt(jQuery(‘html’).css(‘margin-top’), 10) + parseInt(jQuery(‘body’).css(‘margin-top’), 10) + 100;if(is_form){jQuery(‘#gform_wrapper_5’).html(form_content.html());if(form_content.hasClass(‘gform_validation_error’)){jQuery(‘#gform_wrapper_5’).addClass(‘gform_validation_error’);} else {jQuery(‘#gform_wrapper_5’).removeClass(‘gform_validation_error’);}setTimeout( function() { /* delay the scroll by 50 milliseconds to fix a bug in chrome */ jQuery(document).scrollTop(jQuery(‘#gform_wrapper_5’).offset().top – mt); }, 50 );if(window[‘gformInitDatepicker’]) {gformInitDatepicker();}if(window[‘gformInitPriceFields’]) {gformInitPriceFields();}var current_page = jQuery(‘#gform_source_page_number_5’).val();gformInitSpinner( 5, ‘https://www.carbonbrief.org/wp-content/plugins/gravityforms/images/spinner.svg’, false );jQuery(document).trigger(‘gform_page_loaded’, [5, current_page]);window[‘gf_submitting_5’] = false;}else if(!is_redirect){var confirmation_content = jQuery(this).contents().find(‘.GF_AJAX_POSTBACK’).html();if(!confirmation_content){confirmation_content = contents;}jQuery(‘#gform_wrapper_5’).replaceWith(confirmation_content);jQuery(document).scrollTop(jQuery(‘#gf_5’).offset().top – mt);jQuery(document).trigger(‘gform_confirmation_loaded’, [5]);window[‘gf_submitting_5’] = false;wp.a11y.speak(jQuery(‘#gform_confirmation_message_5’).text());}else{jQuery(‘#gform_5’).append(contents);if(window[‘gformRedirect’]) {gformRedirect();}}jQuery(document).trigger(“gform_pre_post_render”, [{ formId: “5”, currentPage: “current_page”, abort: function() { this.preventDefault(); } }]); if (event && event.defaultPrevented) { return; } const gformWrapperDiv = document.getElementById( “gform_wrapper_5” ); if ( gformWrapperDiv ) { const visibilitySpan = document.createElement( “span” ); visibilitySpan.id = “gform_visibility_test_5”; gformWrapperDiv.insertAdjacentElement( “afterend”, visibilitySpan ); } const visibilityTestDiv = document.getElementById( “gform_visibility_test_5” ); let postRenderFired = false; function triggerPostRender() { if ( postRenderFired ) { return; } postRenderFired = true; gform.core.triggerPostRenderEvents( 5, current_page ); if ( visibilityTestDiv ) { visibilityTestDiv.parentNode.removeChild( visibilityTestDiv ); } } function debounce( func, wait, immediate ) { var timeout; return function() { var context = this, args = arguments; var later = function() { timeout = null; if ( !immediate ) func.apply( context, args ); }; var callNow = immediate && !timeout; clearTimeout( timeout ); timeout = setTimeout( later, wait ); if ( callNow ) func.apply( context, args ); }; } const debouncedTriggerPostRender = debounce( function() { triggerPostRender(); }, 200 ); if ( visibilityTestDiv && visibilityTestDiv.offsetParent === null ) { const observer = new MutationObserver( ( mutations ) => { mutations.forEach( ( mutation ) => { if ( mutation.type === ‘attributes’ && visibilityTestDiv.offsetParent !== null ) { debouncedTriggerPostRender(); observer.disconnect(); } }); }); observer.observe( document.body, { attributes: true, childList: false, subtree: true, attributeFilter: [ ‘style’, ‘class’ ], }); } else { triggerPostRender(); } } );} );
However, for the first time, this year’s update includes a separate estimate for Greenland ice loss, based on data from one climate model and automatic weather stations, satellites, GPS data and observations from planes.
This approach estimates that the ice sheet lost an even greater 173bn tonnes of ice over 2025-26.
(Scientific estimates for ice loss in Greenland vary because there is incomplete information about how thick the ice sheet is, how fast it is moving as well as the rate at which it is melting at the surface. Scientists use different approaches for accounting for these uncertainties.)
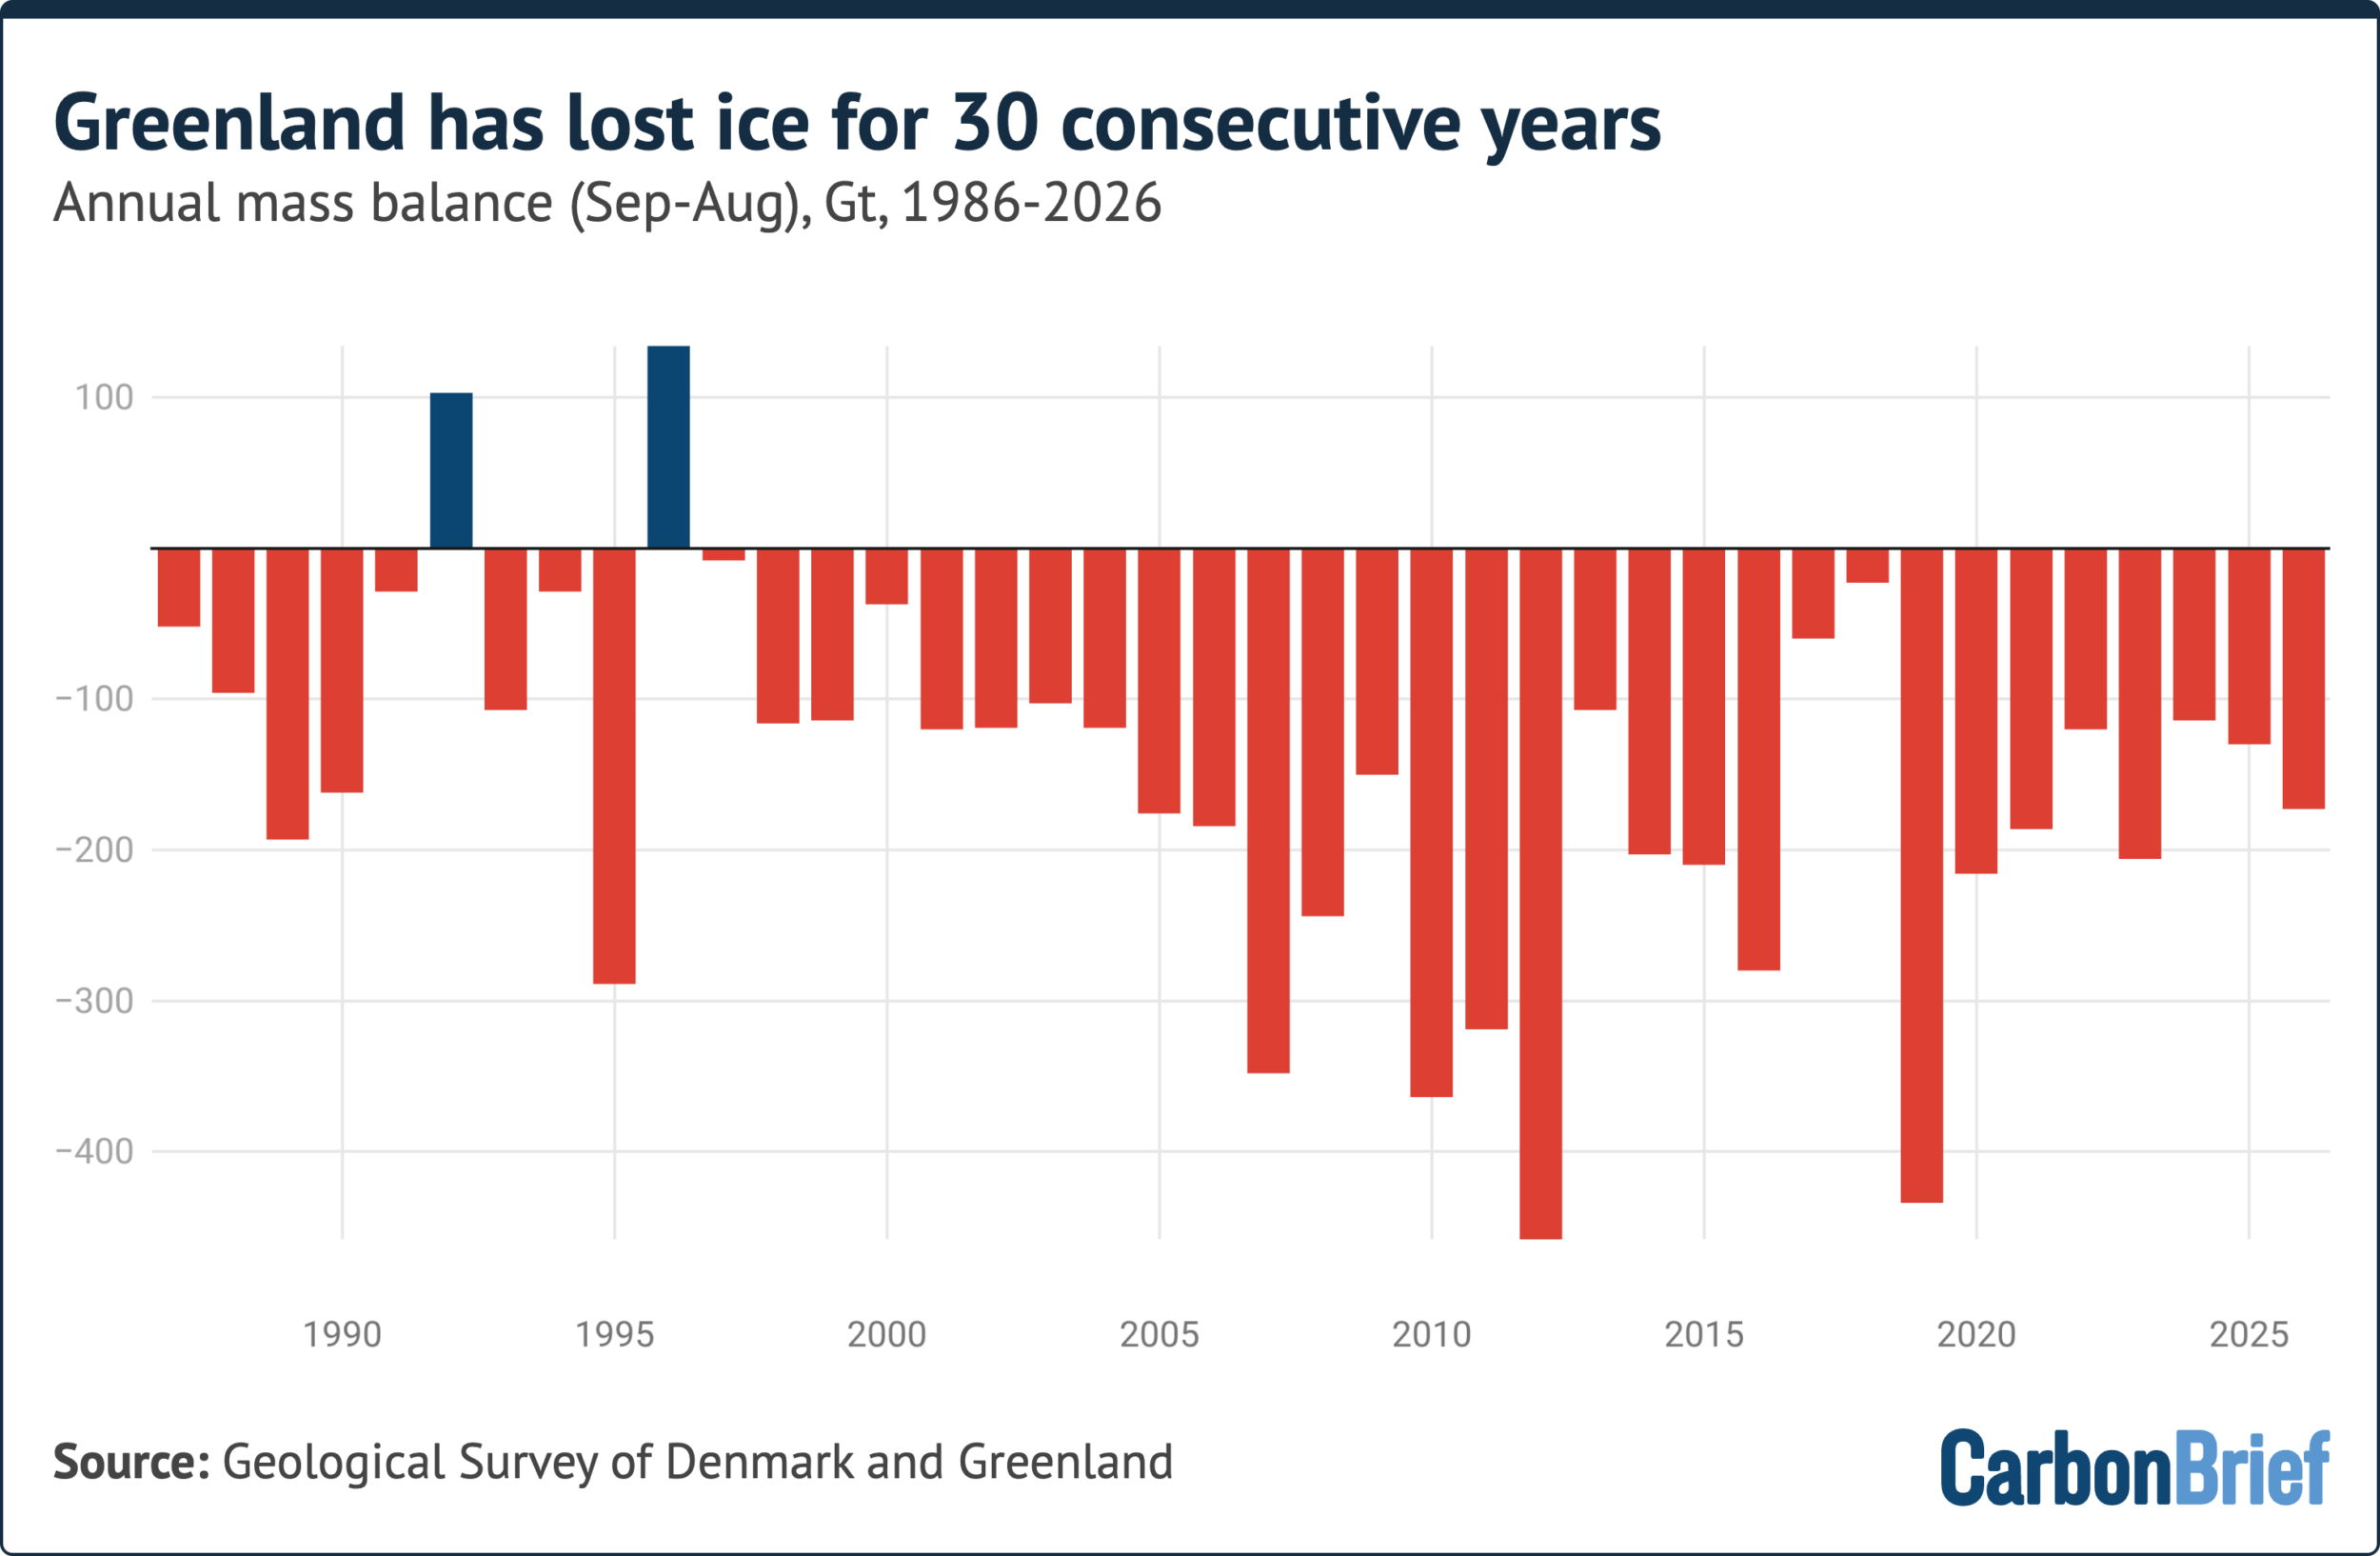
The chart below shows how Greenland’s total mass balance has changed since 1985, featuring the higher 173bn estimate for the last ice cycle year.
It shows how 2025-26 was the 30th consecutive year of ice loss in Greenland, with 1996 the last year that saw an annual net gain of ice.
The chart below shows how Greenland’s surface mass balance, marine mass balance and basal mass balance have changed since 1985. All of these components are combined to calculate the ice sheet’s total mass balance (red).
Surface melt
Winter and early spring in 2025-26 were unusually dry in the southern half of Greenland, leaving around 40bn tonnes less snow on the ice sheet than normal.
Dry winters typically mean high ice melt rates later on, given that heavier winter snowfall often acts as a protective shield that prevents ice loss in the early part of summer.
However, the relatively dry winter was followed by a relatively cool start of summer. Frequent snowfall and extensive cloud cover limited the sun’s ability to warm the surface at the time of year when solar radiation is typically strongest.
The onset of the melt season – the first of at least three consecutive days with melting over more than 5% of the ice sheet – occurred on 5 June, nine days later than the 1981-2010 average.
From the end of June, the weather in Greenland changed markedly, as warm, sunny conditions took hold.
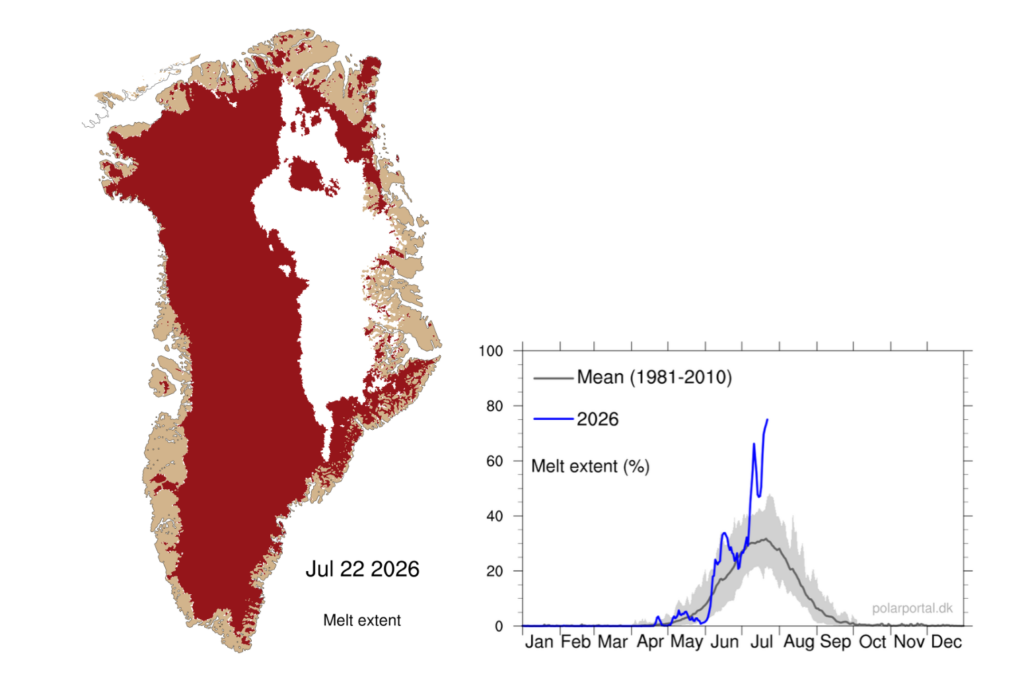
During the first 20 days of July, melting was well above the 1981-2020 average. At its peak on 22 July, melting covered 74.9% of the ice sheet.
(For comparison, July 2025 holds the record for melt area in Greenland, when 81.2% of the continent was melting simultaneously.)
However, the early season fresh snow in June helped to form a cold and bright buffer, reducing the subsequent summer ice melt and runoff.
The map below shows how roughly three-quarters of Greenland’s ice sheet – shaded in red – was experiencing surface melt on 22 July. The chart shows how surface melt on that date (blue line) outpaced the 1981-2010 average (grey line and shading).
Snowfall
As mentioned above, snowfall is the only way for the ice sheet to gain mass.
Because the dry 2025-26 winter did not provide the usual thick layer of snow to act as a protective buffer, the ice sheet started the summer already “behind” on ice levels.
However, even though there was above-average melting during summer, the surface mass balance remained almost constant from mid-June to mid-July. It was only slightly smaller by the end of August.
This was because much of the melt trickled into the snow below and refroze.
South-east Greenland is typically the wettest part of the ice sheet and this year was no exception. Unlike other years though, there was also significant snowfall on the west coast north of Nuussuaq.
Summer snowfall helps to preserve the ice sheet, as fresh snow is brighter than old glacier ice and reflects more of the sun’s energy back to space.
Increases in both snowfall and melt are in line with what scientists expect in a warming climate. Warmer air holds more water vapour, bringing more snow and rain, while higher temperatures drive more ice melt.
Iceberg calving
The most dramatic ice loss of 2025-26 happened at Greenland’s edges.
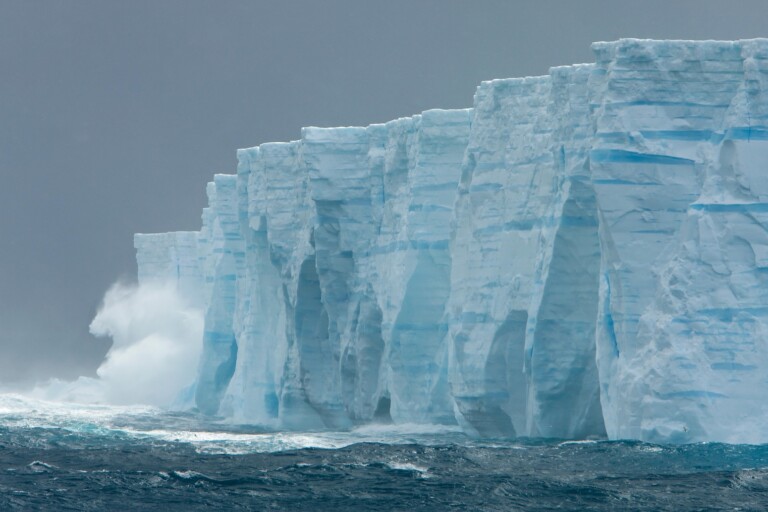
On 4 August, a vast tabular iceberg – an “ice island” with nearly vertical sides and a flat top – broke away from the floating ice tongue of Petermann glacier in north-west Greenland.
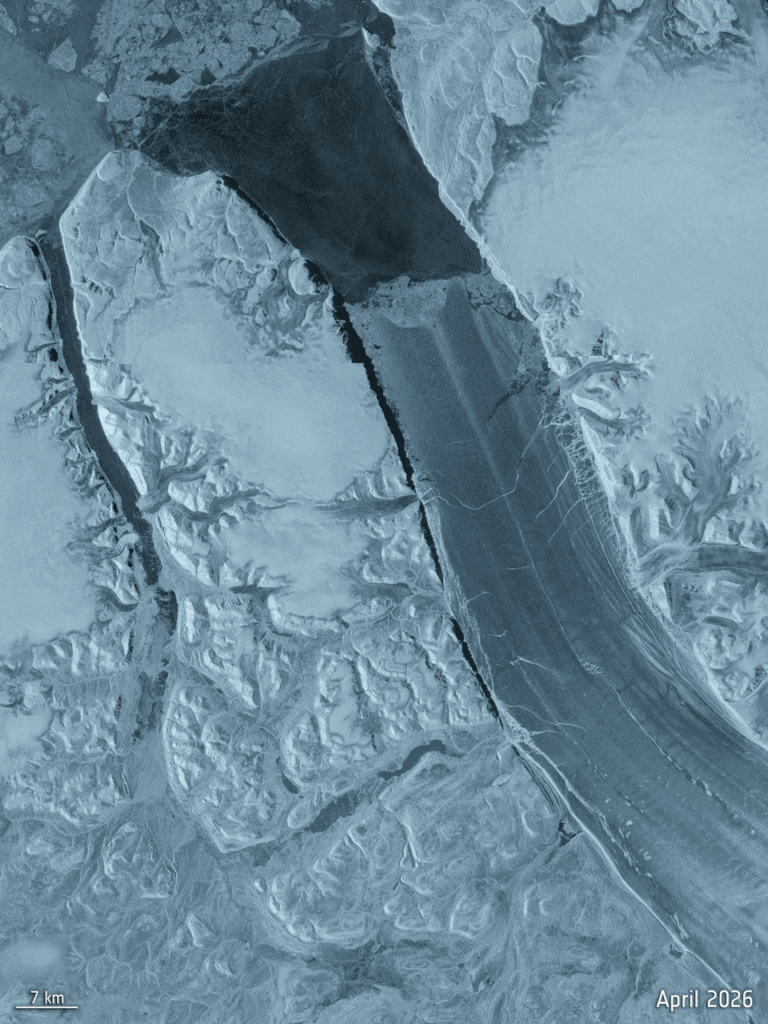
More than 76 square kilometres (km2) in size, with an estimated thickness of 150 metres, the amount of water frozen in this iceberg would be enough to submerge the entirety of greater London to a depth of 6.65m.
This was the largest loss of floating ice at the Petermann glacier since 2012 and the biggest calving event by any Arctic glacier since 2020.
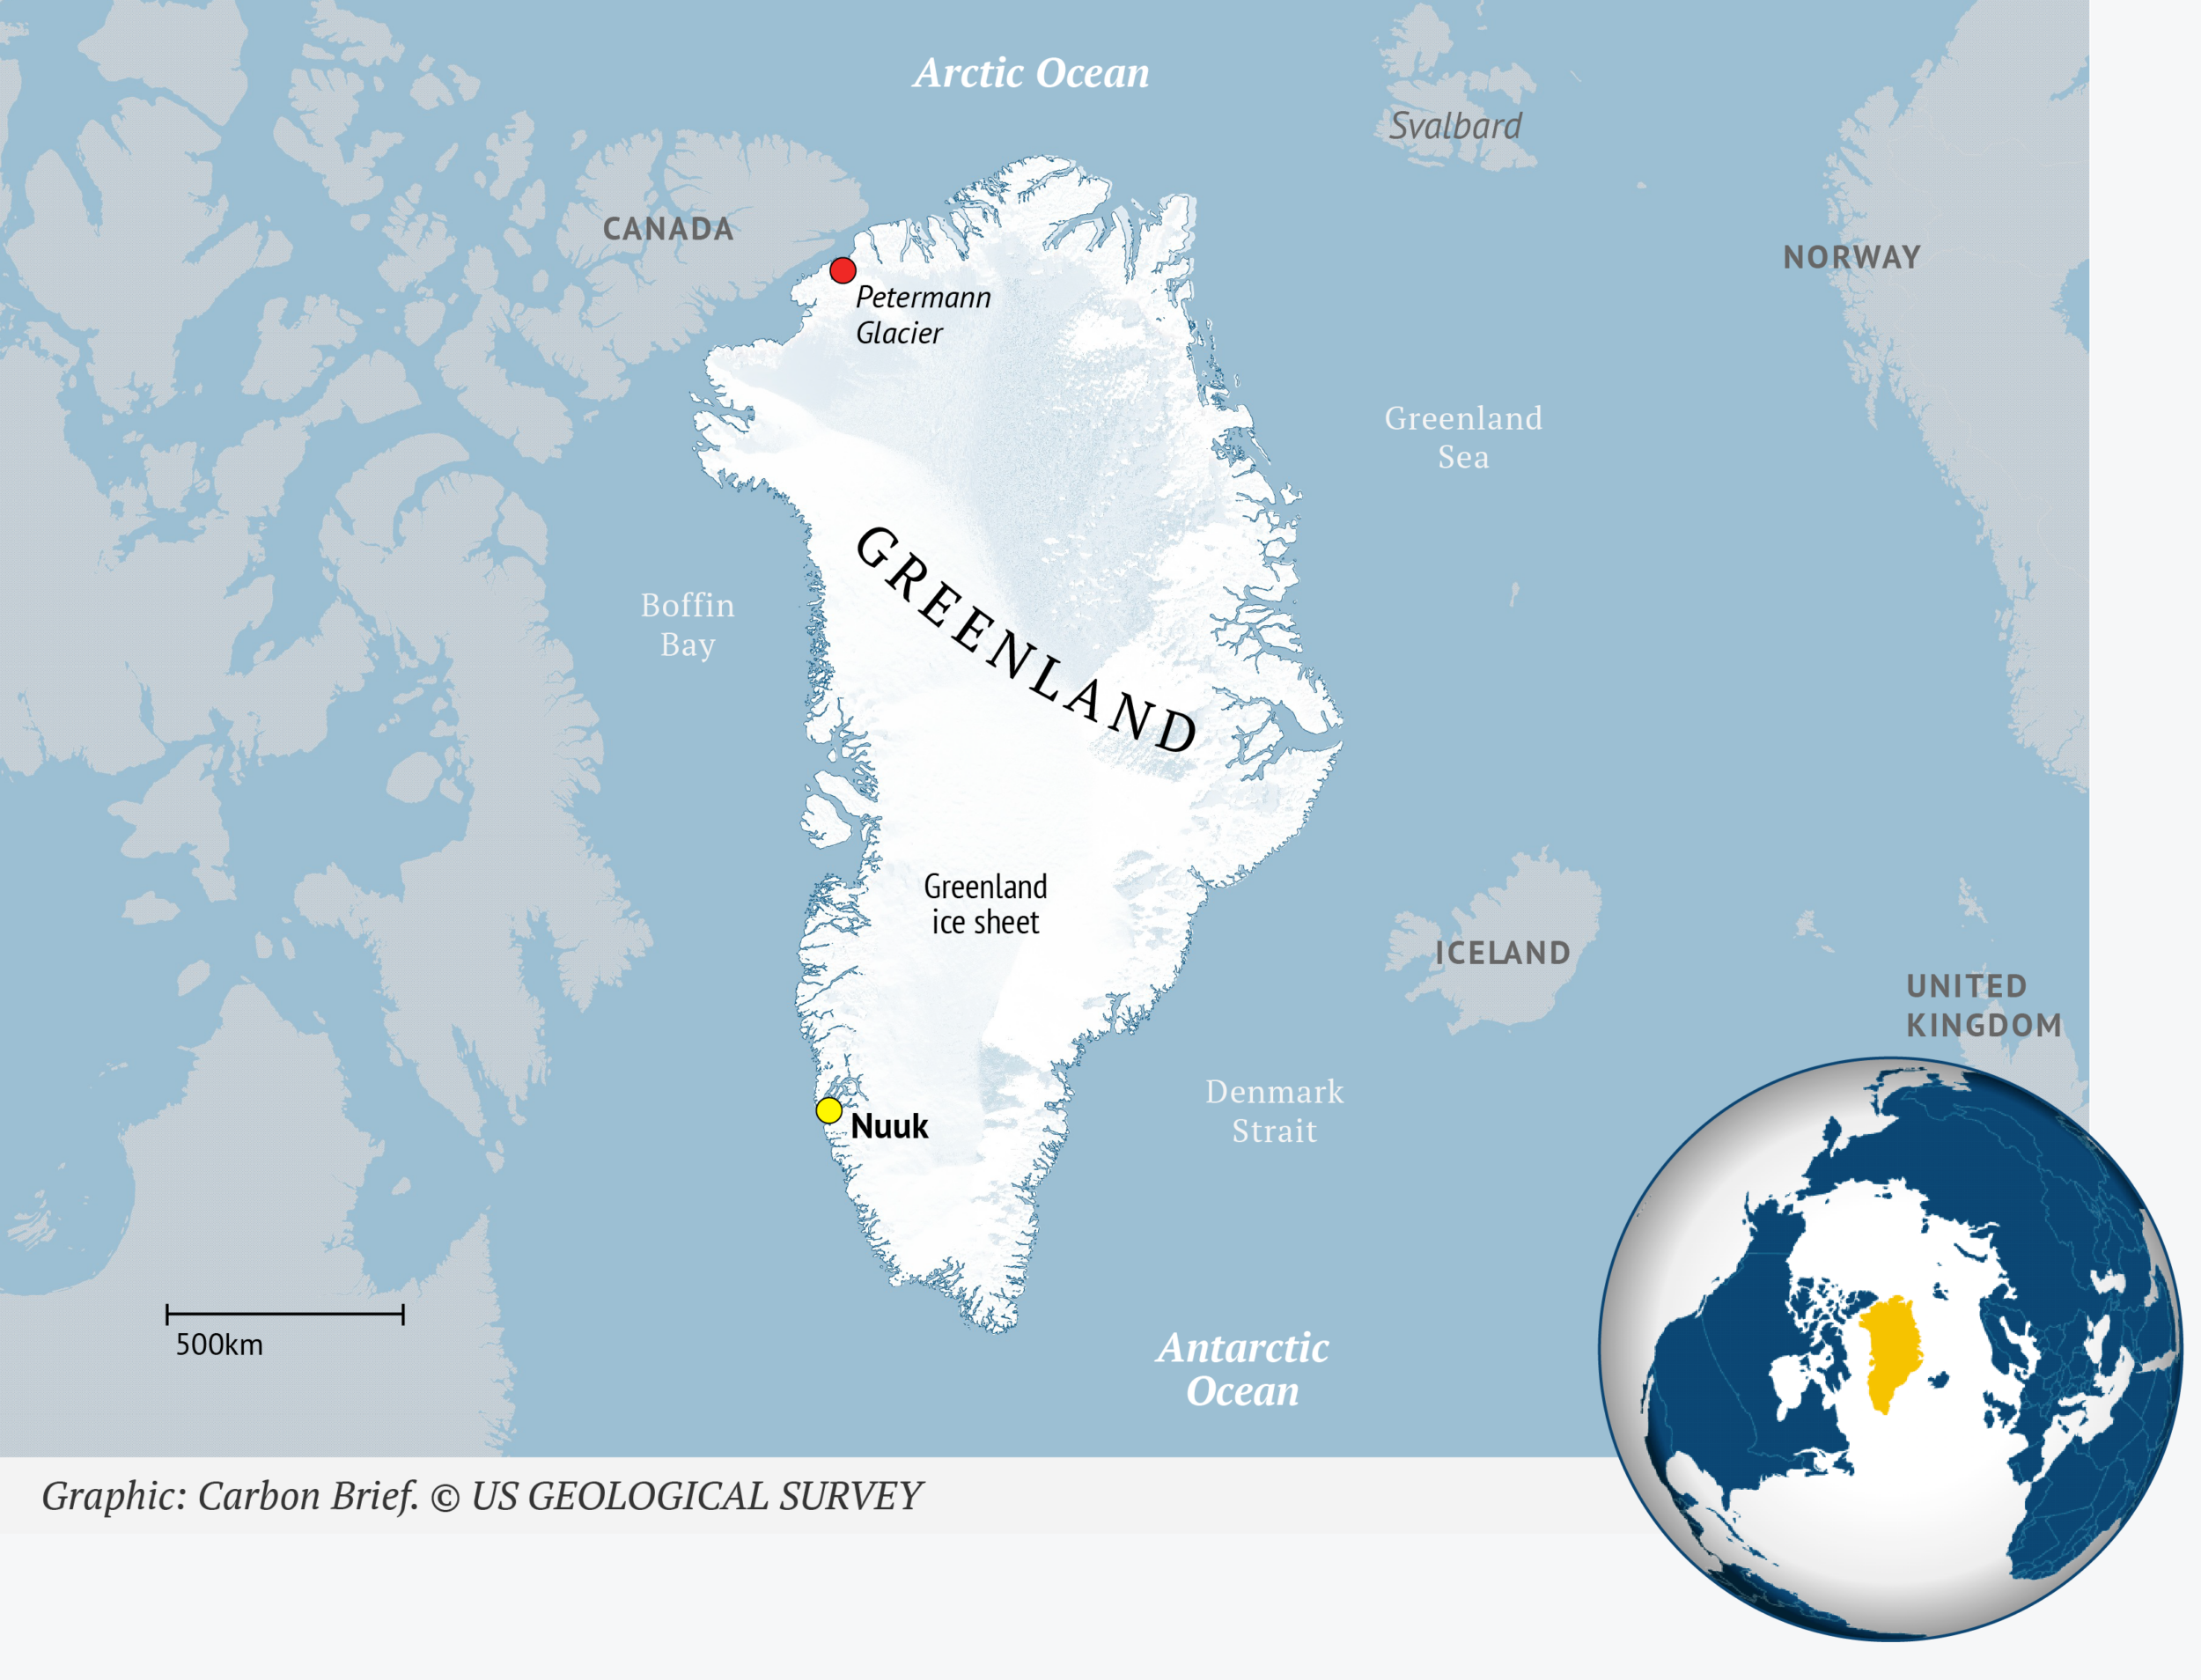
Similar breakoffs occurred in 2010 and 2012 and the current one had long been expected, given growing cracks in the glacier for several years.
Scientists anticipate more calving events at the Petermann glacier. Two further ice islands, with estimated areas of roughly 94 and 84km2, are expected to detach as existing rifts continue to cut across the ice tongue.
Together, the three would remove about 22% of Petermann’s remaining floating ice.
Because the ice tongue is already floating, this calving does not directly raise sea levels. But Petermann is one of Greenland’s largest marine-terminating glaciers, acting as a brake on ice flowing from the interior to the ocean.
The recent breakaway is a reminder that calving and glacier retreat continue apace in Greenland, even in years when the surface mass budget is unremarkable. (To date, calving and glacier retreat have driven roughly two-thirds of total ice loss on the continent.)
The impact of global weather
Greenland’s relatively high surface mass balance in 2025-26 can be explained, in part, by the hot summer in Europe.
Multiple heatwaves were observed across southern Europe and North America over the summer of 2026, with temperature records recorded in multiple countries.
When high-pressure systems that cause heatwaves become blocked in place, the jet stream – fast-moving winds that blow from west to east high in the atmosphere – is shaped like the Greek capital letter Omega (Ω). This is the pattern that dominated this year.
Warm conditions settle near the cores of high-pressure systems, while cool, wet conditions can be found at the “feet” of the Omega.
This year, Greenland was on the right side of the Omega-shaped jet stream and thus experienced cooler conditions.
If the Omega pattern had been displaced by half a wavelength, Greenland would have likely seen warm temperatures that brought record levels of melt – and a lower surface mass balance.
Three decades of decline
So, why does the milestone of 30 years of ice mass decline in Greenland matter?
A single year, however dramatic, can be strongly influenced by the weather. An extreme melt summer – or an unusually cold, snowy one – says little on its own about the region’s long-term trajectory.
This is why climate scientists typically look at 30-year periods when distinguishing a change in climate from natural variability.
Thirty years of data shows that the annual ice budget in Greenland has ended in the red, without exception, since 1996. This applies to warm years, cold years and snowy years.
The largest single-year loss remains 2012, when around 458bn tonnes of ice disappeared from the ice sheet.
The past two years have been moderate by comparison – yet even these “quiet” years produced losses of more than 100bn tonnes each.
Thirty years of data on ice mass decline means that scientists now can confidently say that Greenland mass loss is due to climate change.
Greenland in the global sea level picture
A new assessment highlights how Greenland’s losses are the largest single contribution from the ice sheets to global sea level rise.
The Ice Sheet Mass Balance Intercomparison Exercise (IMBIE) combines 42 independent estimates of ice sheet mass change from satellite gravimetry, altimetry and the input-output method – including the Danish Meteorological Institute’s surface mass balance estimates detailed in this article – all into a single record.
The latest assessment, published in the journal Scientific Data in September, shows that Greenland and Antarctica together lost 11,309bn tonnes of ice between 1979 and 2023, raising global sea levels by around 32mm.
The two ice sheets now account for almost one-quarter of observed global sea level rise.
Greenland dominates that record. It lost 6,215bn tonnes of ice between 1972 and 2023 – an average of 119bn tonnes per year. Two-thirds of the loss was driven by increased ice discharge and one-third by reduced surface mass balance due to increased melt.
Annual losses from ice melt accelerated from around 60bn tonnes in the 1980s to 264bn tonnes in the 2010s.
In contrast, Antarctica lost 4,780bn tonnes over the same period, raising sea levels by around 13mm.
All of Antarctica’s losses are due to discharge from the ice sheet, concentrated in west Antarctica. East Antarctica, on the other hand, has so far remained relatively stable, with record snowfall in recent years even producing a small mass gain.
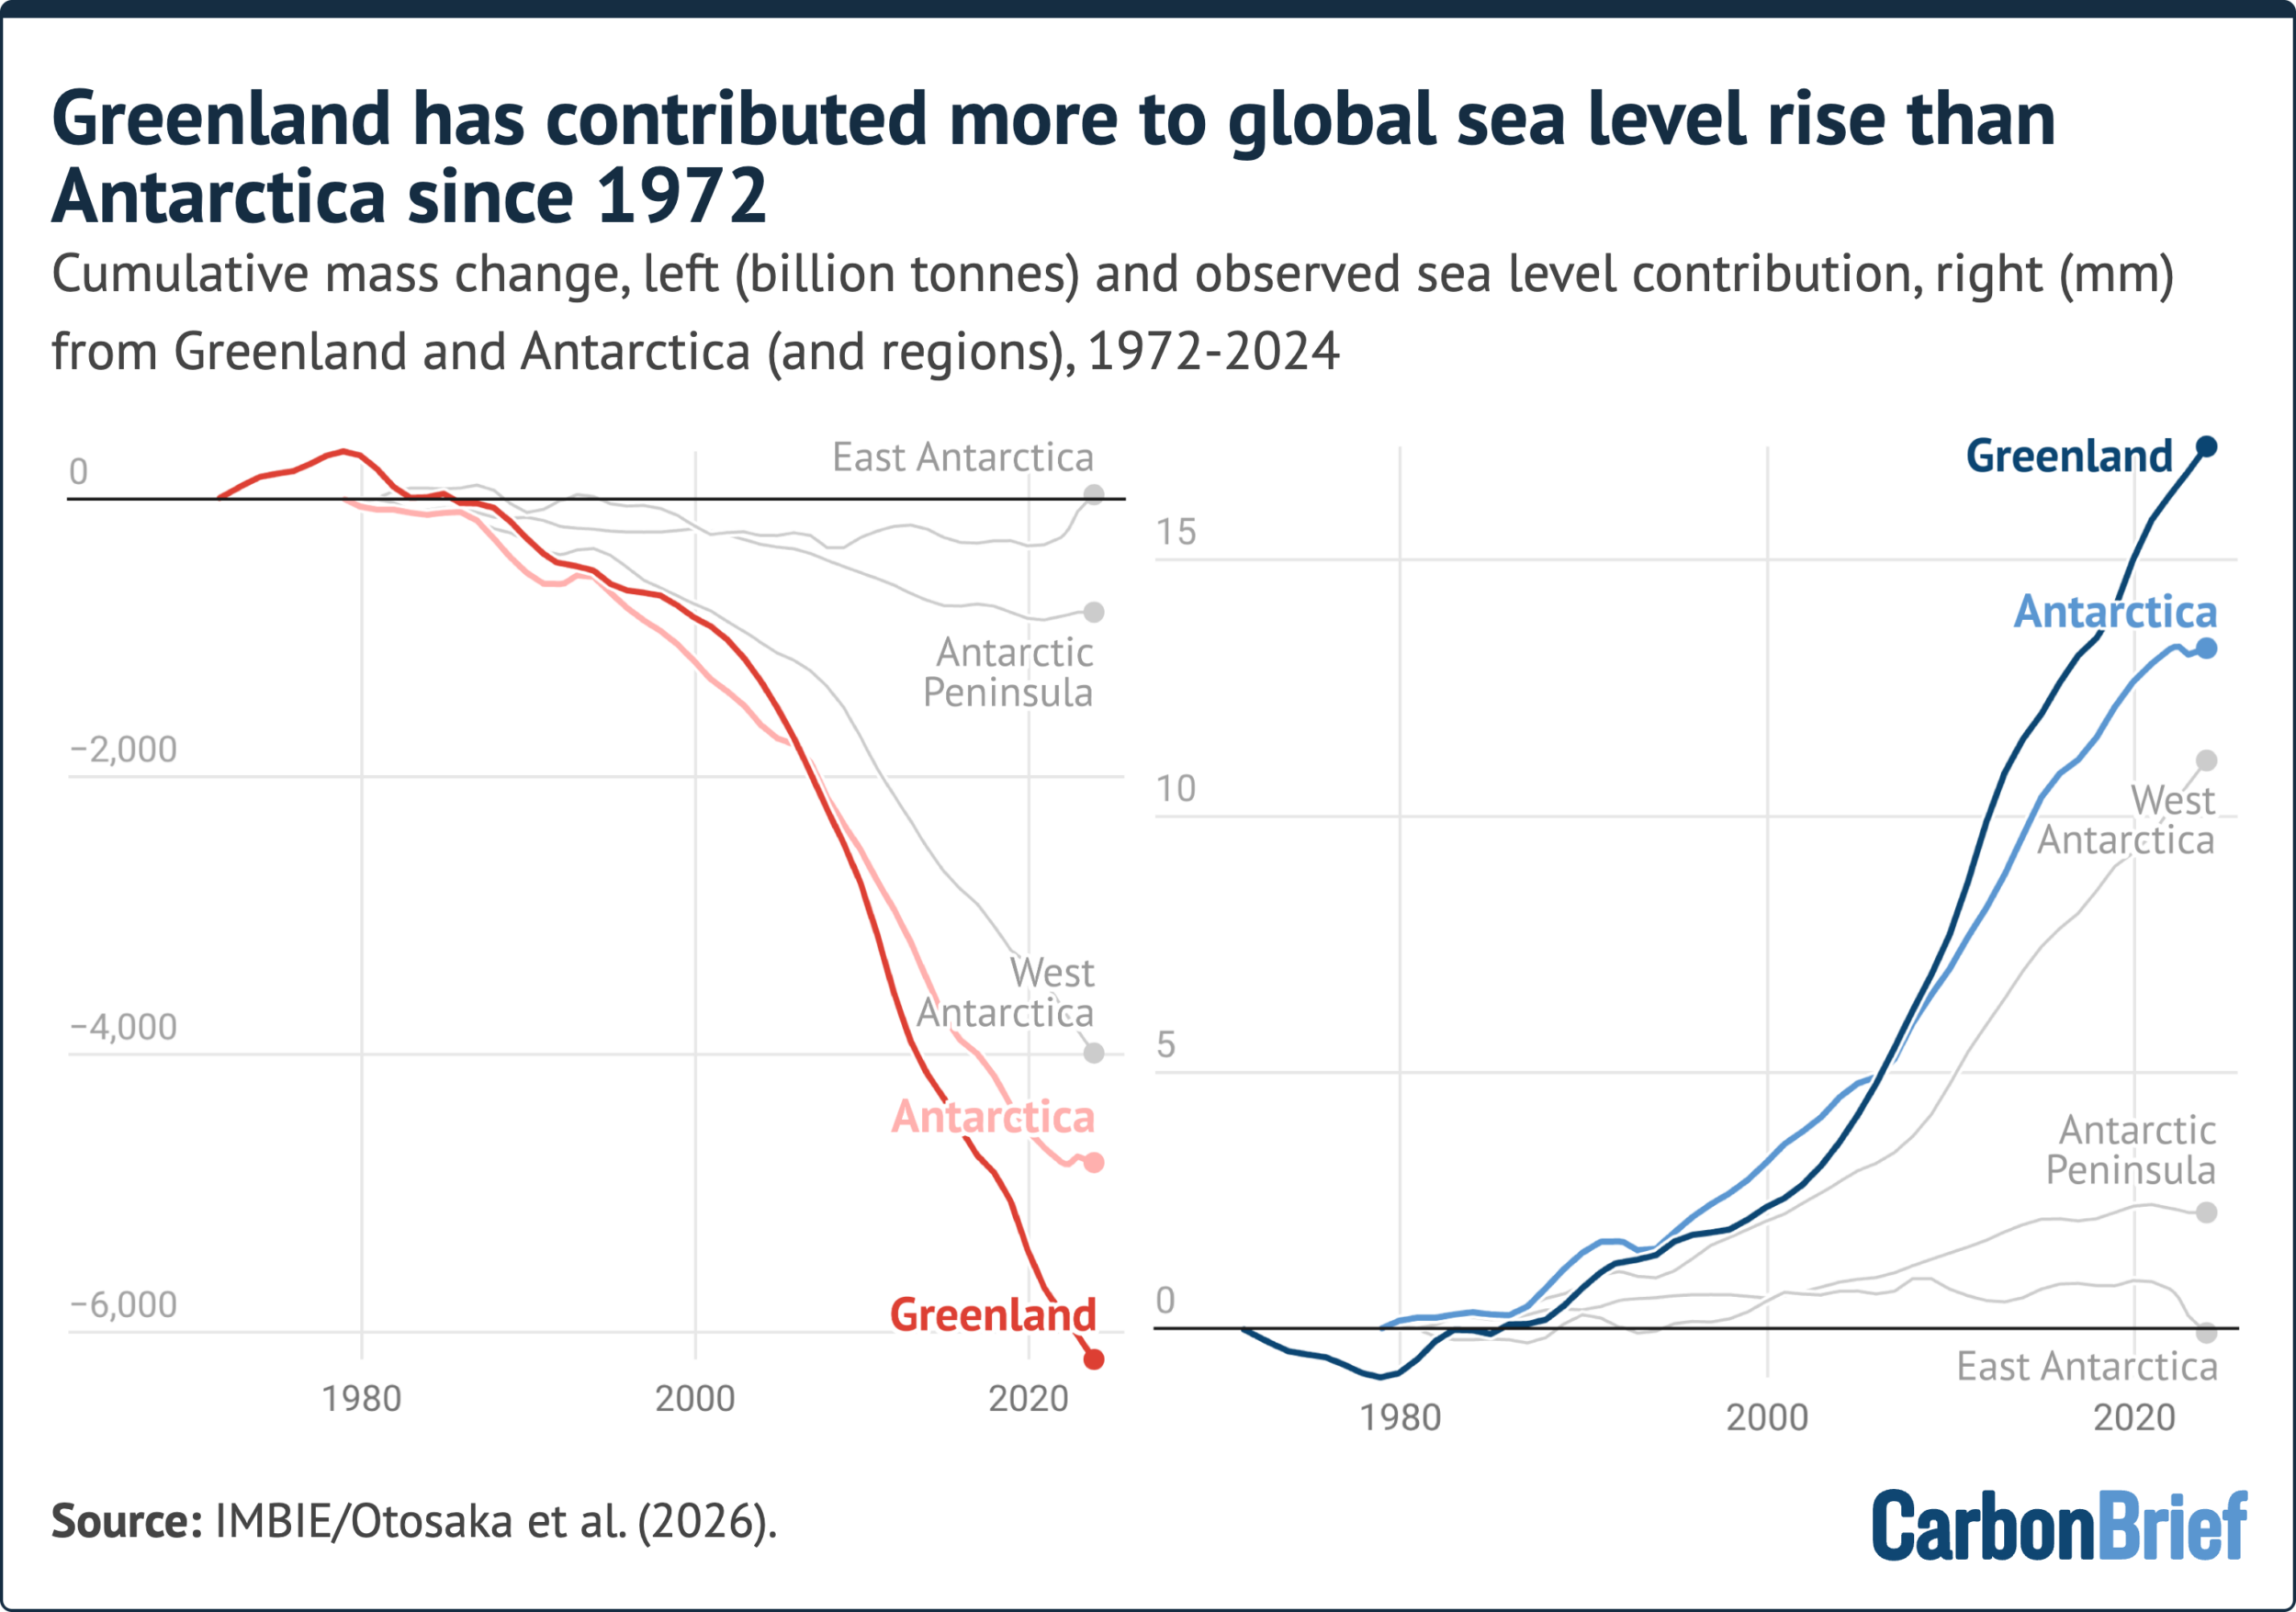
This division in sea-level contribution is expected to change. Greenland’s losses to date amount to only a few centimetres of sea level rise, but Antarctica’s ice sheet is roughly 10 times larger and therefore could lead to significantly more sea level rise in the future.
The IMBIE assessment notes that Antarctica’s losses are dominated by marine-terminating glaciers whose stability is hardest to predict.
The processes now increasingly observed in Antarctica – increasing surface melt, shrinking sea ice, loss of ice shelves and seasonal patterns of retreat of outlet glaciers – have been seen in Greenland for decades. We call this the “Greenlandification” of Antarctica.
Greenland, in other words, is not just the largest present-day source of ice-driven sea level rise – it is also a preview of what may come from the far larger ice sheet at the other end of the planet.